
What is the Persona Distribution?
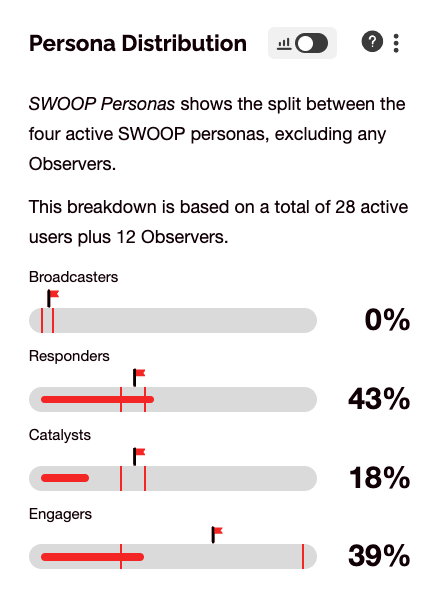
The Persona Distribution report in SWOOP for Viva Engage is available in the Segments, Threads, Topics, Communities and Enterprise dashboards. It identifies the distribution of the four non-observer SWOOP Personas (Engagers, Catalysts, Responders and Broadcasters). We encourage organisations to maximise the proportion of Engagers, Catalysts and Responders.
Our research identifies stronger performance when the positive behavioural personas are being demonstrated. We do anticipate that the mix may change according to the context of the group being analysed. For example, if a group is established to broadcast announcements, then a higher proportion of Broadcasters and Catalysts would be anticipated.
Important note: The definition of an active user in the Persona Distribution report is different to the Interactive Users and Interactive Members reports. To be considered an active user in the Persona Distribution report a person must have made an average of minimum one post, or reply or reaction for every two weeks. This is a more stringent requirement than how an Interactive user or an interactive member is defined as it only requires one post, reply or reaction over the reporting period (ie not every 2 weeks). Therefore, you are likely to see a lower count of active users in the Persona Distribution report.
How to use the Persona Distribution report
The SWOOP personas have become the most engaging measure to encourage behaviour change. It is one of the few truly behavioural measures that can be found on analytics dashboards. Their validity has been confirmed by independent research groups at the University of Sydney and Griffith University. Monitoring and then coaching for positive interaction behaviours ‘online’ has been shown to also leak into the ‘off-line’ world and vice versa. Behavioural change is hard. Using analytics to target collaboration behaviours is therefore an imperative.
You can compare the distribution of the various SWOOP personas with what 'good' looks like. This goal is represented by the goal flags and the red vertical lines that represents the range of the goal. Note that the goal feature is only visible when you have selected the 3-month default date-range in the date selector.
Connect and discuss
Want to talk with others about this? Join our User Group on LinkedIn.