In SWOOP for Viva Engage, you can compare your organisation's use of Viva Engage with other organisations that have opted in to participate in benchmarking.
Your use of Viva Engage will be compared across 15 core metrics that are important to achieve the most common vision of Viva Engage: To create a truly connected and collaborative organisation.
The Enterprise benchmarks are updated on a quarterly basis. New customers' Enterprise Benchmarking reports will only appear once the benchmarks have been updated. If you access the report before this time, you will see an error message.
Viva Engage Benchmarking Metrics
The benchmarking results are available on the Enterprise Dashboard on the Benchmarking tab:
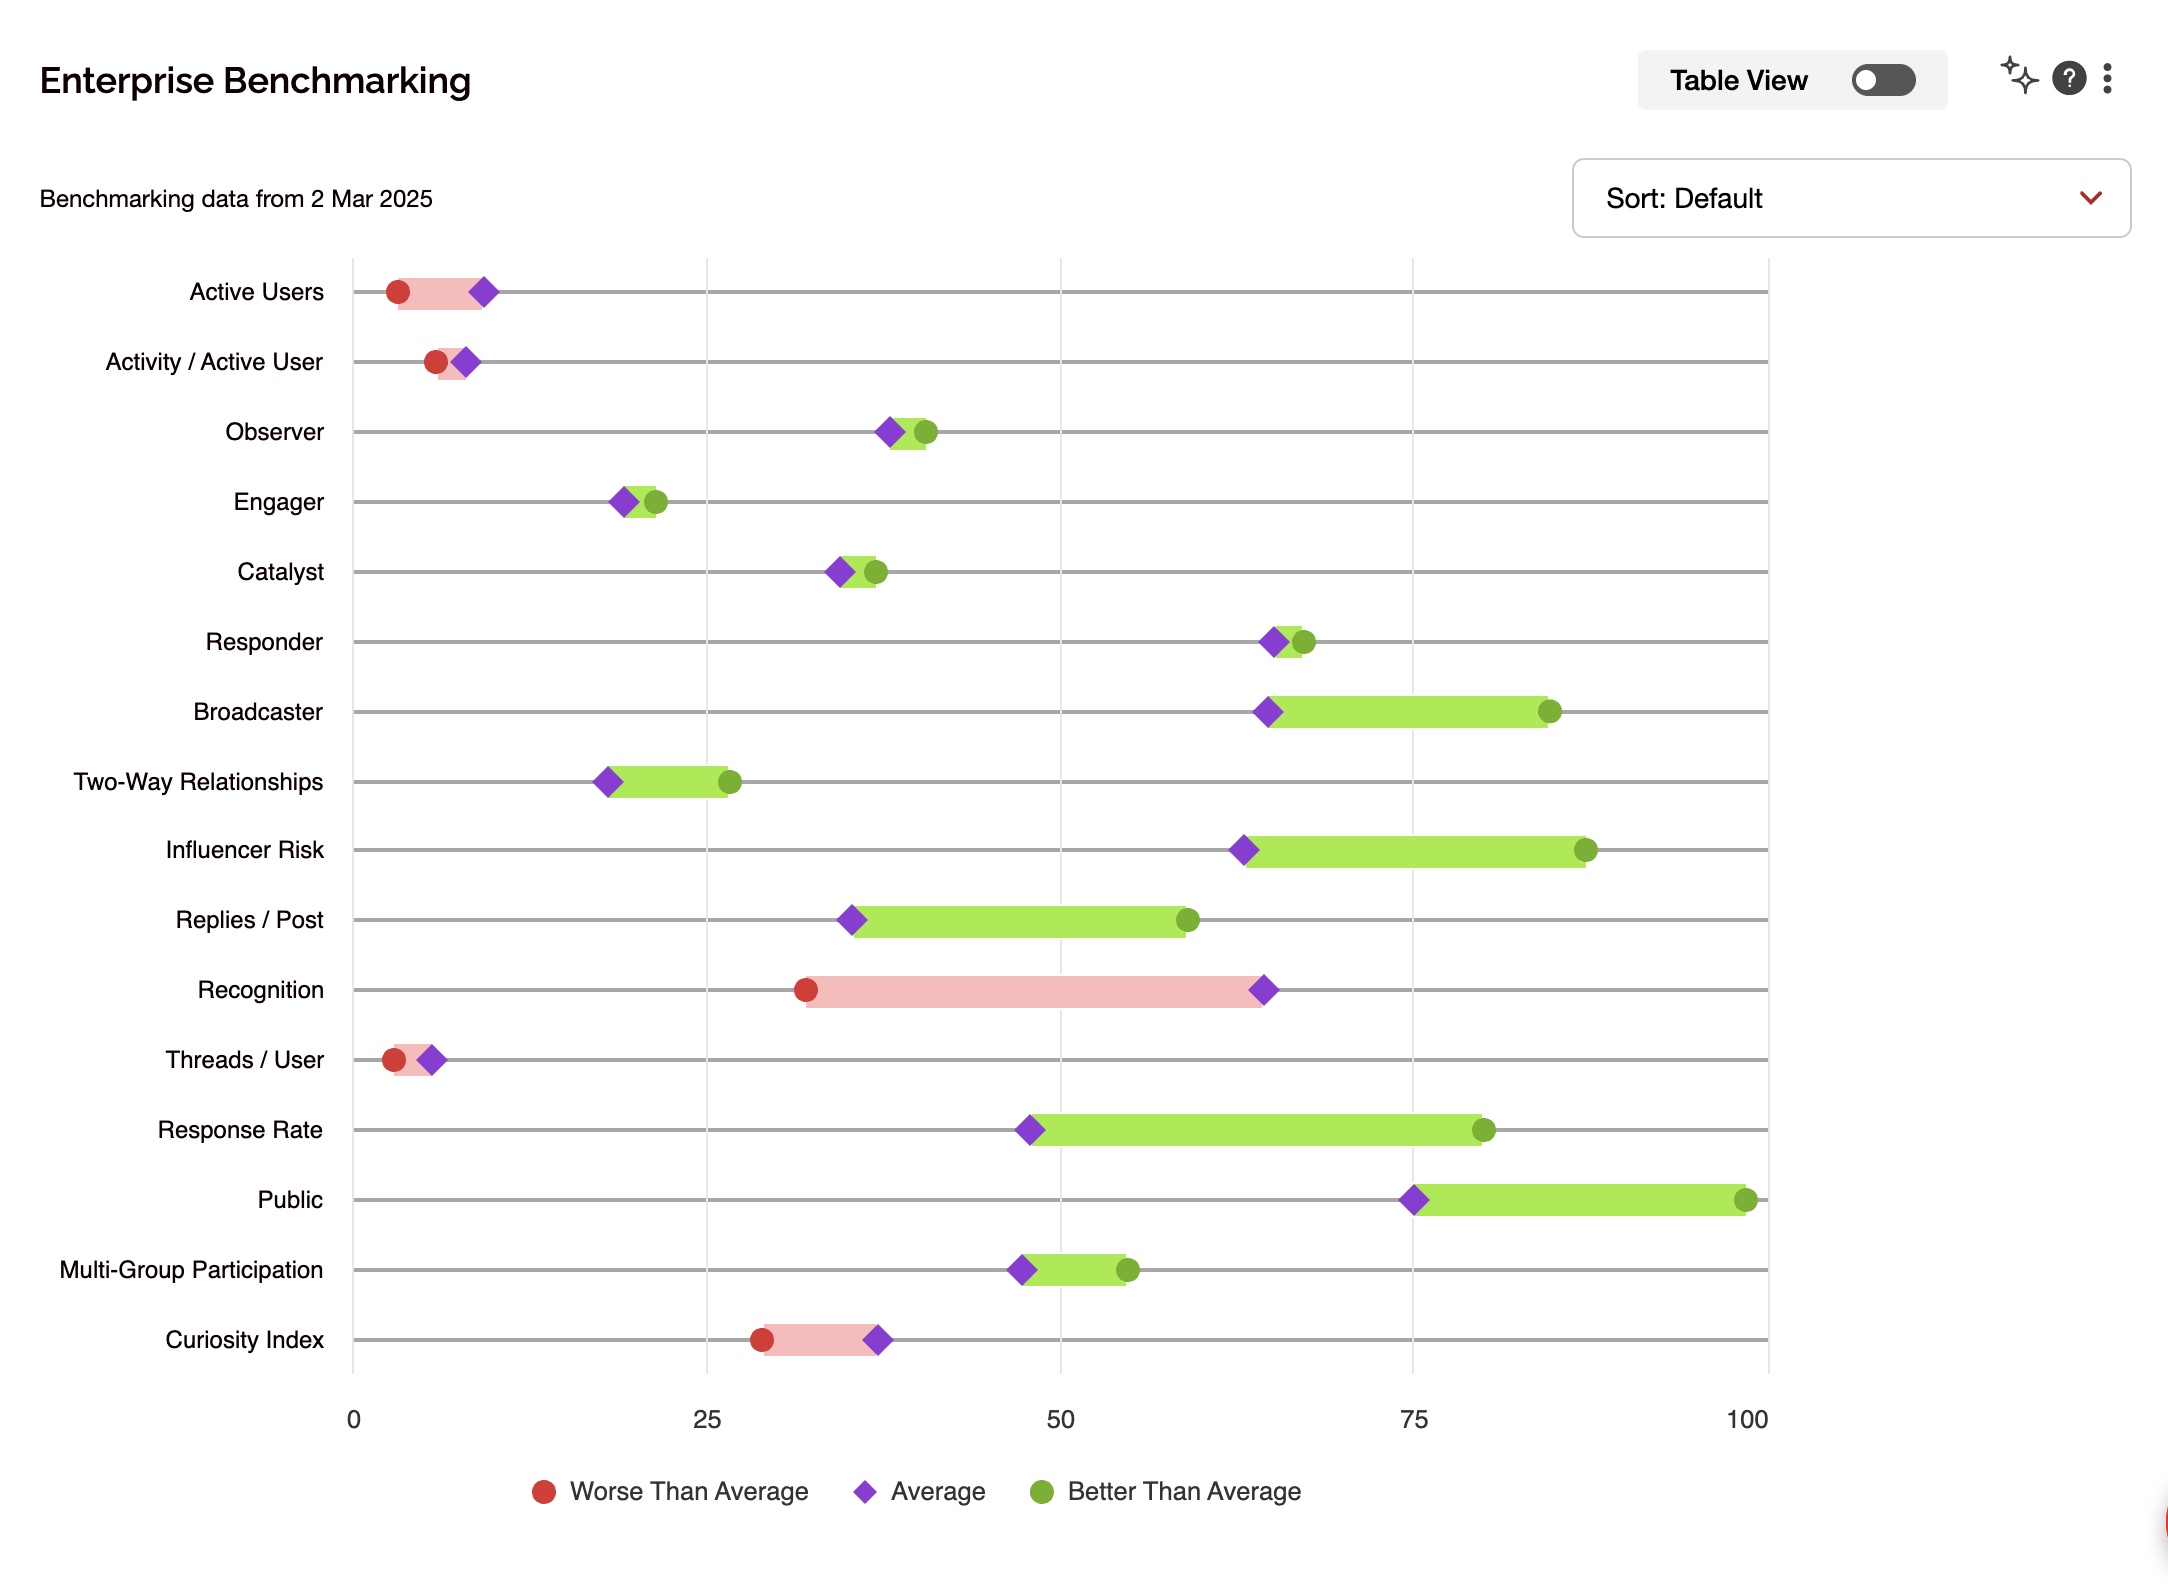
Here is an outline of what each metrics mean:
- Active Users: This metric refers to the percentage of users who have engaged in tangible actions like posting, replying, or reacting. It indicates the size of your Viva Engage network compared to the others in the benchmarking data set.
- Activity / Active User: This measures the average number of interactions (posts, replies, likes) per active user over a specific period. It’s relevant as it helps gauge how engaged users are within the platform, indicating the overall health of interactions.
- Observer: Measures the percentage of Observers. This persona represents users who primarily consume content without actively participating. Observers are essential to understand the passive audience and can provide insights on how to encourage more engagement.
- Engager: Measures the percentage of Engagers. Engagers balance posting and responding, fostering relationship-building. This metric is relevant as it shows the presence of individuals who facilitate conversations and connections among users, enhancing community dynamics
- Catalyst: Measures the percentage of Catalysts. Catalysts initiate conversations and discussions, making them valuable for sparking engagement. A higher percentage of Catalysts indicates a vibrant community that encourages participation and dialogue.
- Responder: Measures the percentage of Responders. Responders react to others' posts with replies and likes. This metric is important because it reflects the level of engagement and interaction within the community, suggesting that conversations are being nurtured.
- Broadcaster: Measures the percentage of Broadcasters. This persona represents users who primarily share content that gains little traction. Understanding the proportion of Broadcasters can help organisations identify content strategies that may need improvement. You want to reduce the percentage of Broadcasters.
- Two-Way Relationships: This metric assesses how many relationships within Viva Engage are reciprocal. It is relevant as two-way communication is essential for effective collaboration and engagement.
- Influencer Risk: This calculates the degree to which the network is dependent on a few key individuals. A high Influencer Risk indicates a lack of diversity in engagement, which can be detrimental to overall collaboration. Therefore you want this number to be low.
- Replies / Post: This measures the average number of replies per post. It is significant because a high ratio indicates active discussions and engagement, moving beyond simple broadcasting to collaborative conversations.
- Recognition: This metric tracks how often users acknowledge (recognise) each other’s contributions by reacting to messages (eg clicking 'like'). It’s important to foster a positive community culture where individuals feel valued and appreciated.
- Threads / User: This metric measures the average number of discussion threads initiated by each user. A higher number indicates proactive engagement and a willingness to contribute to community discussions.
- Response Rate: This indicates the percentage of posts that receive a reply. A high response rate signals effective communication, suggesting that posts are generating interest and dialogue.
- Public: This measures the percentage of messages that are open and available across the network. A high percentage of public messages promotes transparency and broad knowledge sharing, which is vital for organisational learning.
- Multi-Group Participation: This metric tracks how actively individuals participate in multiple communities. Engagement across various groups indicates a diverse interest and can foster innovation through diverse interactions.
Get commentary and recommended actions
If you have enabled SWOOP Analytics' AI-powered coach - Dr SWOOP - you can click on the AI sparkle icon to get a custom interpretation of the data along with recommended actions.